Revenue Forecast For Investigational Therapeutic – Free Tool
February 19, 2020
BioHeights has launched a new tool that allows to forecast revenue for an investigational therapeutic. In the main menu, go to Tools – Revenue Forecast Calculator.
Why should you give it a try? Building your own drug revenue forecast model from scratch is time consuming. Instead, you can test your product and market assumptions using our flexible tool.
The tool has 5 key features
The tool accommodates multiple disease indications
Built-in prevalence and incidence data for over 170 diseases
Current version allows users to toggle between U.S., EU5, and Japan
It accommodates both basic and advanced inputs. All inputs could be over-written by user
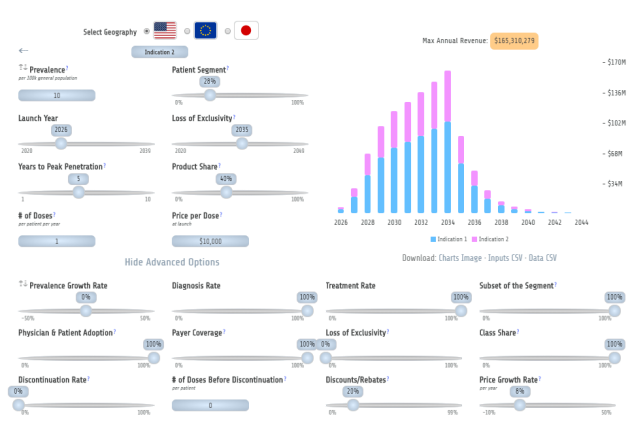
Graphical output overlays all indications and displays maximum annual revenue forecast. Responsive graphical output reacts immediately to changes in input(s)
Basic Inputs
Basic modifiable inputs include Market and Product assumptions, while overall country populations are taken from Worldometers.
Market Inputs
Prevalence and Incidence. Users can choose whether Prevalence or Incidence rate is driving sales in each specific disease market
Addressable Patient Segment. Obviously, not all patients with the disease will need or be eligible to receive a product
Product Inputs
Expected Launch Year, which depends on current status of development and projected timeline
Year of expected Loss of Exclusivity, which is dependent on the underlying intellectual property, as well as any received designations related to extending exclusivity
The expected number of Years to Peak Penetration. This parameter reflects how slow or fast the drug will reach all its addressable patient population and maximum market share
Expected Product Share (i.e., market share)
The number of Doses per patient per year
Finally, Price per Dose
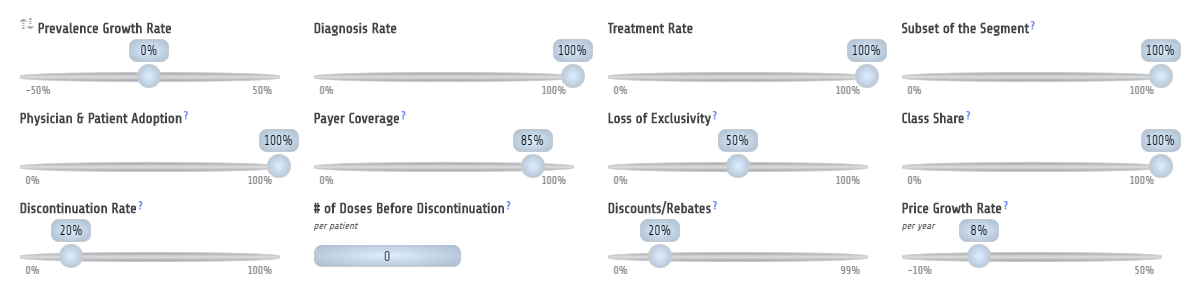
Advanced Options
Additionally, the tool features advanced input options for product and market assumptions. Market assumptions include Prevalence/Incidence annual growth rates, Diagnosis and Treatment rates, more granular patient segmentation. Product assumptions include Payer Coverage, remaining % of revenue after the Loss of Exclusivity, additional competitive market share, Drug Discontinuation inputs, Discounts/Rebates, and annual Price Growth Rate.
Finally, for further description, hover over ‘?’ sign next to each input parameter.
Disclaimer: This tool is the property of BioHeights LLC. The model is designed only for educational purposes. This is not a financial advice. BioHeights LLC and its members are not responsible for anybody’s actions, losses, or damages resulting from using this tool.
Try it and shoot us an email at bioheights@pm.me with any questions, comments, request, and feedback. We look forward to hearing about your experience with the tool.