BioHeights has launched a Risk-Adjusted NPV calculator for an investigational product. In the Main menu, go to Tools – RA NPV forecast.
The Risk-Adjusted Net Present Value (RA NPV) is a useful metric to compare several programs in terms of their risk and value. For example, an early-stage (i.e., riskier) product with higher revenue potential may be as attractive as a late-stage (i.e., less risky) product with lower revenue potential.
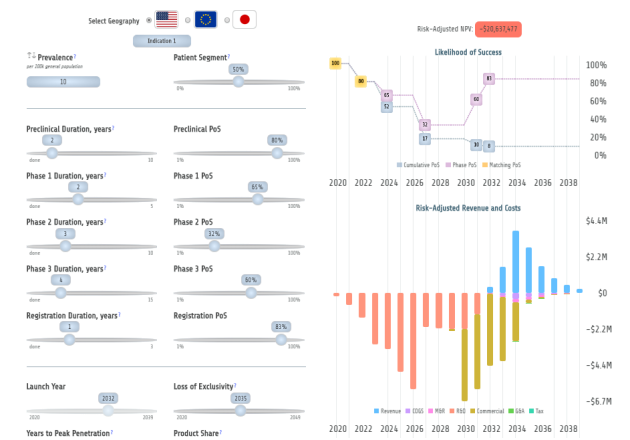
Probability of Success section of the RA NPV forecast calculator (left). PoS chart (top right). RA Revenue and Costs chart (bottom right).
Overall, RA NPV calculations include Revenue, Costs, Cash Flow, and Risk parameters. For description of Revenue inputs, please check our Revenue Calculator. For description of Costs and Cash Flow inputs, please check our NRA NPV calculator. Finally, Risk is expressed using PoS for each phase of development as described below in more detail.
Risk Adjustment Using Probability of Success
First, PoS values for each development stage are automatically populated upon indication selection. Currently, these values are based on average PoS of corresponding therapeutic areas as reported by Hay, M., et al. (Nature Biotechnology, Jan 2014, Vol 32, N 1, pp. 40-51.) We are expanding our PoS database to include more options. Importantly, users can overwrite PoS values for any of the stages.
Second, users should assign duration (in years) to each stage of development (Preclinical, Phase 1, Phase 2, Phase 3, Registration) based on a product. Consequently, the calculator automatically outputs the Launch Year based on set duration inputs. In contrast to Revenue and NRA NPV models, RA NPV forecast calculator does not allow users to change Launch Year. Also, the calculator does not allow Loss of Exclusivity Year to be lower than Launch Year.
Lastly, the top “Likelihood of Success” chart shows two curves. One is PoS for each stage (pink). The other is the cumulative PoS (blue). Specifically, cumulative PoS is a product of all probabilities from the current phase of development to approval.
Please Subscribe below to receive email notifications about new tools and blog posts. Also, check out our blog articles on the Insights page.
Disclaimer: This risk-adjusted NPV forecast model/ calculator is the property of BioHeights LLC. We designed this model only for educational purposes. Importantly, this is not a financial advice. BioHeights LLC and its members are not responsible for anybody’s actions, losses, or damages resulting from using this model.